Purpose
The purpose of this procedure is to describe the operating procedure of UV-Spectrophotometer Shimadzu, UV-1800.
Scope and Application
This procedure applies to all UV-Spectrophotometers Shimadzu, UV-1800 in the Laboratory.
Responsibility
|
Tasks |
Responsibility |
|
Responsible to perform all the activities as per the SP and to maintain and record all the activities as per the SP. |
Analyst/User/Technical Staff/In-charge Section/ D& M |
|
Responsible to write/review the SP in coordination with the analyst/user and to update the SP for more GLP Compliance. |
Deputy QMS / Deputy Technical Manager |
|
Responsible to check the SP as per the prescribed SP format and to ensure the implementation of all activities as per SP. |
Technical Manager |
|
Responsible to review the SP as per the standard practices and to review and audit the implementation of SP. |
QMS Manager |
|
Responsible to approve/authorize the SP and to verify the implementation of all activities as per SP. |
Director |
Term & Definitions
- SP: Standard Operating Procedure
- Lab: your lab name/industry
- Tech.: Technical
- QMS: Quality Management System
- D & M: Development and maintenance
- Cal: Calibration
Procedure
- Turning ON the power:Connect the unit to power supply by inserting cable through stabilizer to power outlet.
- Turn on the instrument by pressing “I “on power switch “I / O” placed on the right bottom of the uv-1800.

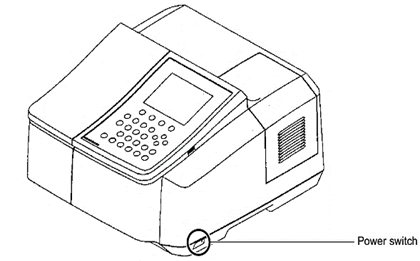
Items to be initialized appear on the screen and starts being checked sequentially. It will take almost four minutes.
Each item is initialized in order, and if the initialization of the item is properly completed, “OK” is displayed next to the item.
If any abnormality is detected, however, “NG” is displayed and the initialization process is terminated.
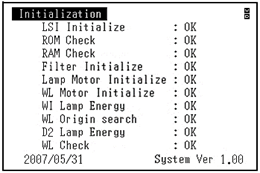
|
Initialization items |
Description |
|
LSI Initialize |
Initializes each I/O device. |
|
ROM Check |
Checks program ROM. |
|
RAM Check |
Checks memory elements (RAM). |
|
Filter Initialize |
Detects the reference position of the stray light filter. |
|
Lamp Motor Initialize |
Detects the reference position of the motor that drives the light source switching mirror. |
|
WL Motor Initialize |
Detects the mechanical wavelength origin position. |
|
WI Lamp Energy |
Checks whether or not the WI (halogen) lamp light energy is at a sufficient level. |
|
WL Origin search |
Checks 0-order light which is the optical origin. |
|
D2 Lamp Energy |
Checks whether or not the D2 lamp (deuterium) lamp light energy is at a sufficient level. |
|
WL Check |
Checks wavelength by detecting the emission line at 656.1 nm using the D2 lamp. |
When all initialization items are judged “OK”, the Mode menu screen appears.
Light source lamp icon on the right top of LCD screen indicates its illumination status. “D” and “W” stands for deuterium and halogen lamp respectively.
Manual Operation:
- Selecting the parameters:
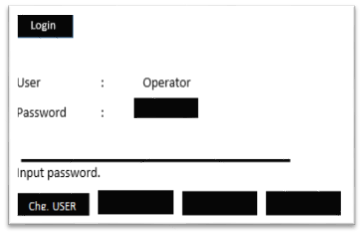
- Log in screen appears. Press the “ENTER” directly, as no password is assigned.
[Mode Menu] screen appears when initializing steps are judged “OK”.
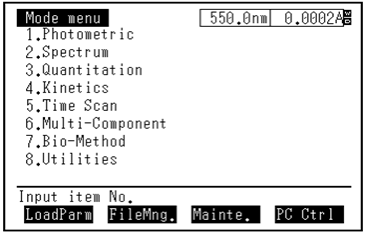
Select the Spectrum mode by pressing “2” key. Measurement Configuration screen for Absorbance mode will be displayed.
Following key operations are selected in this mode by pressing corresponding numerical keys.
|
Key Operations |
Display |
Description |
Recommended settings |
|
[1] |
[Meas. Mode] |
Selecting measuring Mode (Abs / %T) |
Absorbance |
|
[2] |
[Scan range] |
Along (x-axis) Wavelength 190nm to 1100nm |
set accordingly |
|
[3] |
[Rec. range] |
Along (y-axis) For Abs.-.4.000 to 4.000 |
0 to 2.000 |
|
[4] |
[Scan Speed] |
Wavelength scanning rate (Fast; Medium; Slow; Very Slow) |
Fast or Medium |
|
[5] |
[Scan Pitch] |
Selecting pitch during wave scan: AUTO, 0.05, 0.1,0.2,0.5,1.0,2.0 |
AUTO is selected |
|
[6] |
[ No. of scans] |
No. of time scan will be repeated: 1 to 99 times |
1 |
|
[7] |
[Display Mode] |
Sequential or Overlay |
Usually Sequential |
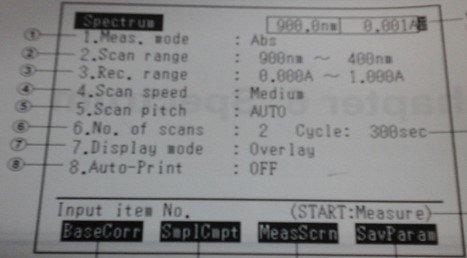
Selection is done from key pad and is confirmed by pressing key [ENTER] (Note: starting wavelength must be longer than end wavelength).
Press [CE] key to clear a numeric value error and re-enter appropriate values.
Loading Samples and Reference
- Open Sample Compartment cover.
- Take out the both quartz cells from measurement side (front) and reference side (rear) cell holders, in sample compartment.
- Rinse and fill cuvettes with solvent of sample dilution/s. Dry the outer surface of quartz cells with soft tissue paper or the microfibre cloth/lint-free cloth, tissue.
- Close Sample Compartment cover.
Taking Blank:
Press [AUTO ZERO] on keypad for “blank setting/ zeroing” that can be shown on right top corner of the LCD. Remove the quartz cell from front side holder, discard the solvent. Rinse and fill the cuvettes with sample dilutions and wipe outer surface with dry tissue paper or the microfibre cloth/lint-free cloth, tissue. (Same procedure is adopted for reference standard dilution).
Starting Test:
Press the [START/STOP] key in Measurement Configuration screen. It starts the measurement and a spectral waveform is plotted in real time. Current status of Wavelength and respective absorbance is shown on right top corner of “LCD”.
Note: Measurement can be terminated at any point of measurement by pressing [START/STOP] key.
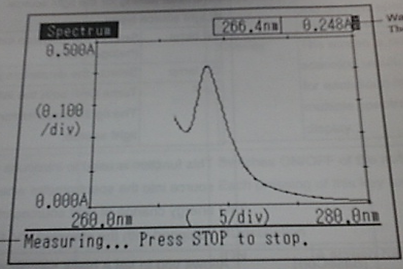
After the measurement, has been finished (stopped), the Curve Display screen is displayed.
Press [F2] “Data Proc” key that will display six Data Processing Options.
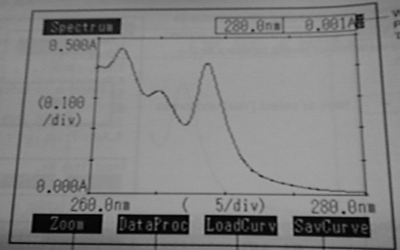
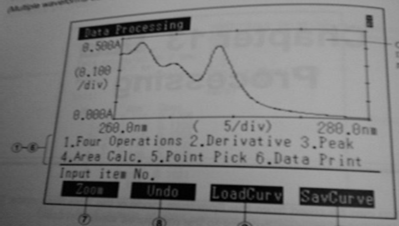
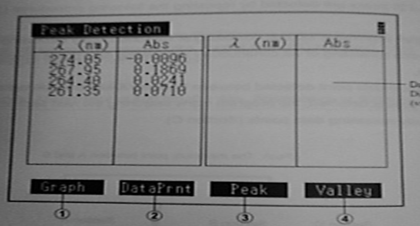
Then press [3] key to detect the peak/s from Curve Data and displays them as list of values
on vertical and horizontal axis (Up to 20 peaks can be detected. If F2 [Data Print] is pressed, screen hard copy will be printed). Absorbance at any specific point (point pick) of spectra can also be observed by pressing [3] on Processing Options Screen.
When [←] or [→] key is pressed in Curve Display screen or Processing Options Screen with which reading with cursor screen is displayed with which wavelength and Data values at any arbitrary cursor position can be read.
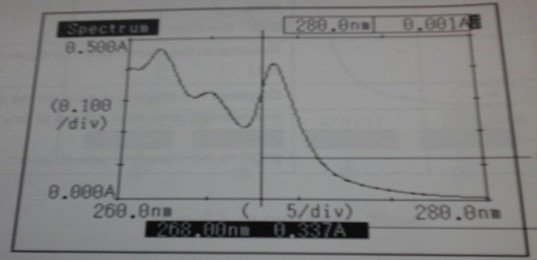
Press [F1] key in Processing Options Screen, zoom screen is displayed that can be enlarged and reduced with changing vertical and horizontal axis of spectra.
Note: F3 and F4 can be pressed to adjust vertical axis range according to displayed curve and to restore it respectively which can be printed with [PRINT] key.
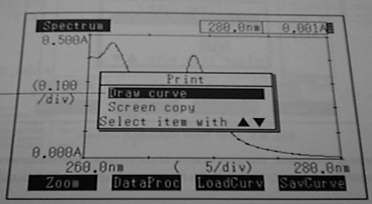
Press the [PRINT] key in curve Display screen. Move the cursor [↑] [↓] to the desired mode either Draw curve or Screen copy and confirm the selection with [ENTER] key.
- Print from selected screen
Note: Take print outs when needed, otherwise note down readings on notebook.
- Print Out report
[RETURN] key is pressed to get back to main screen.
Turn off the unit by pressing ON/OFF button after completion of use.
How does a UV vis spectrophotometer work?
A UV-Vis spectrophotometer measures the absorption of ultraviolet and visible light by a sample. It passes light through a sample solution and detects how much light is absorbed at each wavelength, providing information about the sample’s composition and concentration.
UV vis spectrophotometer how it works
UV-Vis spectrophotometer operates by measuring light absorption in samples across the UV and visible spectra.
What does a UV vis spectrophotometer measure?
A UV-Vis spectrophotometer measures the absorbance of light by molecules in the UV and visible regions of the electromagnetic spectrum. This measurement helps determine concentrations and analyze substances.
What is UV-vis spectrophotometer?
A UV-Vis spectrophotometer is an analytical instrument used to measure how much a chemical substance absorbs light. It’s essential for quantitative and qualitative analysis in various scientific disciplines. a UV-Vis spectrophotometer is a device that measures the absorption of ultraviolet and visible light by substances, providing crucial data about their properties.
How to use UV vis spectrophotometer?
To use a UV-Vis spectrophotometer, prepare a sample solution, place it in a cuvette, select the appropriate wavelength, and measure the absorbance. Calibration with standard solutions may be necessary for accurate results.